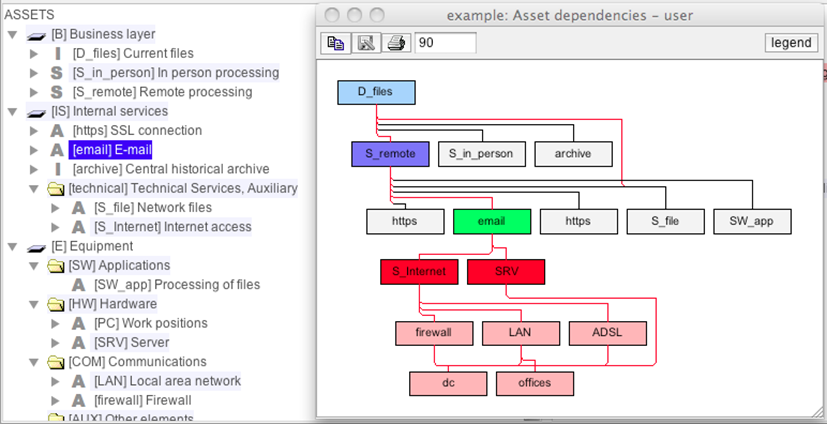
The graph shows the relationships between assets. It only presents the assets related to those selected on the main screen, or all the assets if nothing is selected.
Assets are heuristically positioned so that there is no relation going upwards: all dependencies go from top to bottom. PILAR create connection buses to connect one row to the next, and jump over rows.
The graph tracks the selection on the main dependencies screen. So, if you select an asset, a group or a layer, only the assets in the group and those direct or indirectly linked will appear in the picture.
Furthermore, within the assets shown, if you select one, it becomes green, those above turn red, and those below turn blue.
|
|
copy |
Copies the image to the note pad to paste it somewhere else. |
|
|
save |
to store the picture as an image file. The available image formats depend on the hosting machine; some formats are quite widespread: jpg, jpeg, png |
|
|
print |
to send the picture to a printer |
|
|
scale |
to enlarge / decrease the image |
|
|
legend |
show the colour codes |