One tab per project phase. Click to switch.
Pseudo phase “potential” shows inherent risk without safeguards.
See summary (impact)
See summary (risk)
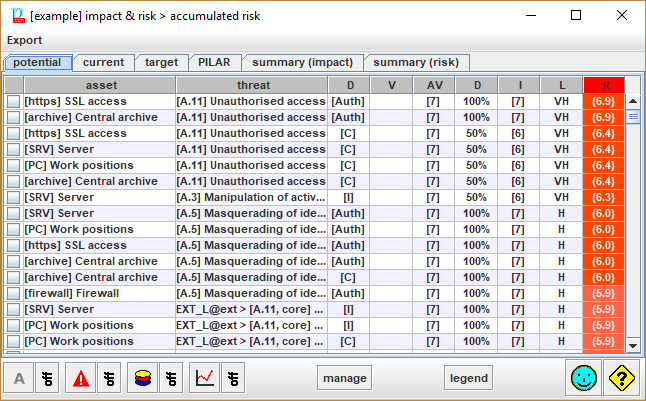
Table columns
Click on column header to use it to sort rows. The header of the selected column is shown in red background.
· asset – the assets
· threat – the threats
· dimension – the security dimension
· V – the own value of the asset, if any
· AV – the value accumulated on the asset
· D – degradation (see Options / Effects
· I – the impact
· L – the likelihood (see Options / Likelihood
·
risk – the risk
|
csv |
Exports values to a CSV file, for excel. |
|
xml |
Exports values to an XML file. |
|
db |
Exports values to a database. |
Bottom toolbar
|
|
To view only a few assets. Click on the image to select the assets to view. Click ON / OFF to switch whether the filter applies or not. |
|
|
To view only a few threats. Click on the image to select the threats to view. Click ON / OFF to switch whether the filter applies or not. |
|
|
To view only a few security dimensions. Click on the image to select the dimensions to view. Click ON / OFF to switch whether the filter applies or not. |
|
|
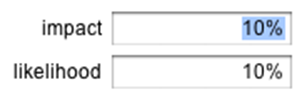
To view only a few risks. Click on the image to select the risks to view. You may specify a percentage for impact, and a percentage for risk. Typical values are 10%, and 10%, selecting the highest 10% of impact, and the highest 10% or risk (that is, the top-right of the impact-likelihood table).
0% means no impact / risk. 100% means any impact / risk. That is, nothing is filtered out. Click ON / OFF to switch whether the filter applies or not. |
|
manage |
For the rows selected in column 1, PILAR collects the risks, and jumps to the safeguard valuation screen, only taking into account the selected risks. |
|
legend |
Initially, rows are sorted according to criticality (risk), then impact, then likelihood.
Click on any header to sort by the corresponding column:
|
assets |
sorted according to their position in the assets’ tree (ascending) |
|
threats |
sorted according to their position in the threats’ tree (ascending) |
|
dimension |
sorted according to their position in the dimensions’ list (ascending) |
|
V |
sorted by asset’s value (descending) |
|
A |
sorted by the accumulated value (descending) |
|
D |
sorted by degradation (descending) |
|
I |
sorted by impact (descending) |
|
F |
sorted by likelihood (descending) |
|
risk |
sorted by risk (descending) |