One tab per project phase. Click to switch.
Pseudo phase “potential” shows inherent risk without safeguards.
· See summary (impact)
· See summary (risk)
Top menu EXPORT
|
csv |
Exports selected rows to a csv file for excel. |
|
xml |
Exports values to an xml file. |
|
db |
Exports values to a database. Only if the license enables the usage of SQL. |
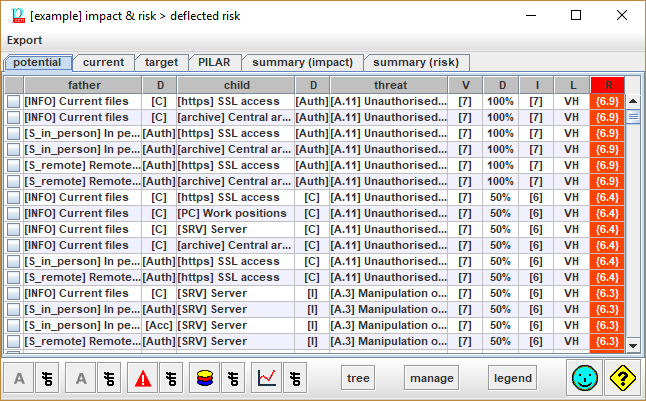
Table columns
|
1 |
selection |
|
|
2 |
father |
The asset above: the one with value where the consequences of the threat are deflected. |
|
3 |
dimension above |
the consequences of the thread are on this dimension |
|
4 |
child |
The asset below: where the threat occurs. |
|
5 |
dimension below |
The dimension affected by the threat on the asset below. |
|
6 |
threat |
The threat |
|
7 |
value |
The value of the asset above on the dimension above. |
|
8 |
degradation |
The degradation caused by the threat on the dimension of the asset |
|
9 |
impact |
Impact of the threat on the dimension of the asset above. |
|
10 |
likelihood |
Likelihood of the threat on the asset. The label on the header follows the option selected to present likelihood (see Options / Likelihood |
Bottom toolbar

|
|
Filter assets above. To view only a few assets. Click on the image to select the assets to view. Click ON / OFF to switch whether the filter applies or not. |
|
|
Filter assets below. To view only a few assets. Click on the image to select the assets to view. Click ON / OFF to switch whether the filter applies or not. |
|
|
To view only a few threats. Click on the image to select the threats to view. Click ON / OFF to switch whether the filter applies or not. |
|
|
To view only a few security dimensions. Click on the image to select the dimensions to view. Click ON / OFF to switch whether the filter applies or not. |
|
|
To view only a few risks. Click on the image to select the risks to view. You may specify a percentage for impact, and a percentage for risk. Typical values are 10%, and 10%, selecting the highest 10% of impact, and the highest 10% or risk (that is, the top-right of the impact-likelihood table). 0% means no impact / risk. 100% means any impact / risk. That is, nothing is filtered out. Click ON / OFF to switch whether the filter applies or not. |
|
TREE |
|
|
manage |
Select one or more rows. For the rows selected, PILAR collects the risks, and jumps to the safeguard valuation screen, only taking into account the selected risks. |
|
legend |
Rows are sorted according to criticality (risk), then impact, then likelihood.
Click on any header to sort by the corresponding column.