Valuation asset by asset
The value of an asset may be
own
because you expicit a value for it (in this screen)
by domains (see “[[ra_ad]]”)
inherited from the essential assets in its domains, or from essential assets from associated domains
by dependencies (see “[[ra_ad]]”)
inherited from assets that depend on it
This screen is used to valuate assets independently, and to inspect the propagated value between assets.
|
Quick start |
|
Which is your major concern with this information system?
Repeat with other concerns until the rest is not so important. Click ACCUMULATED and double check that every asset has a value that makes sense to you. |
Top menu EDIT
|
|
Select one or more value cells. Copy values to be pasted. |
|
|
Select one or more destination cells. Paste the copied values. If the source range is 1 cell, and the destination covers several cells, the value is copied into all of them. |


Top menu EXPORT
|
to CSV |
CSV – comma separated values |
|
to XML |
XML – extensible markup language |
Top menu IMPORT
|
from XML |
XML – extensible markup language |
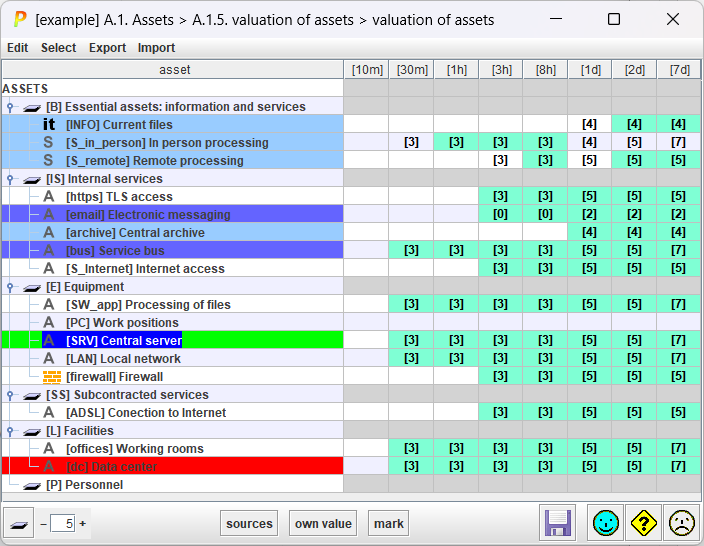
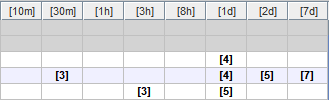
Table - As many columns as interruption intervals.
For each asset and each interval, the value.
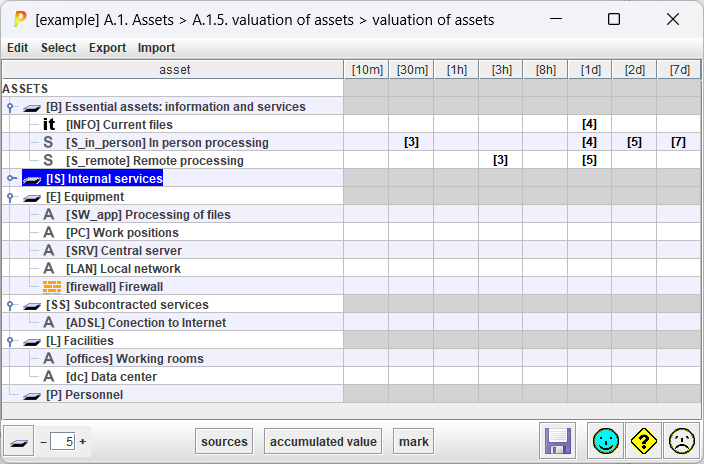
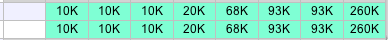
When presenting the own value of the asset, the value is shown on white background.
When presenting the accumulated value on the asset, the accumulated value is presented on green background.
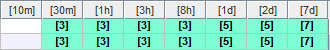
Please, observe that accumulation works in two directions
- first: left to right – the impact in one interval is inherited from previous interval, unless a higher value is explicit
- second: top-down – the assets below inherit the value from the assets above
When the risk analysis is quantitative, the values are numbers.
Bottom toolbar

|
|
Click to collapse assets tree. |
|
|
Control the level of expansion of the assets tree. |
|
sources |
Select one source. PILAR will select the assets in the tree that associated with that source. |
|
accumulated / own value |
Switches from presenting only own value, or also accumulated values. |
|
mark |
Useful to see how value is propagated. Select one cell in [6] or [7], click MARK. The value source is on green background. The destination of the value is on black background. For instance, to see how the needs on accountability are translated into integrity and authenticity of activity registers:
|


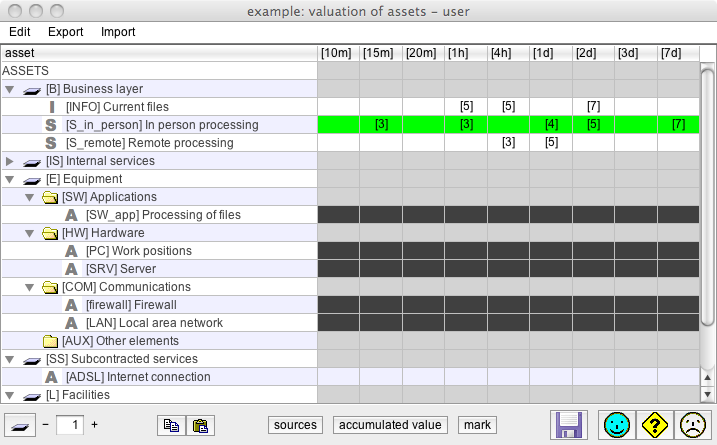
The first column presents the assets, organised as a tree. The other columns cover interruption intervals. Only assets may receive values; the other rows are dead.
The screen allows to
- [for quantitative analysis] to introduce a numerical value
- to introduce a comment explaining why this value
- to select the criteria that apply from those in the library.
It is important to try to use encoded criteria.
To discover where does the accumulated value come from …
- select the asset (row)
- click SOURCES
As an alternative, you may select an asset on the asset tree, and PILAR colours the assets above and below: